

Microsoft Viva Goals
Manage and achieve your business goals
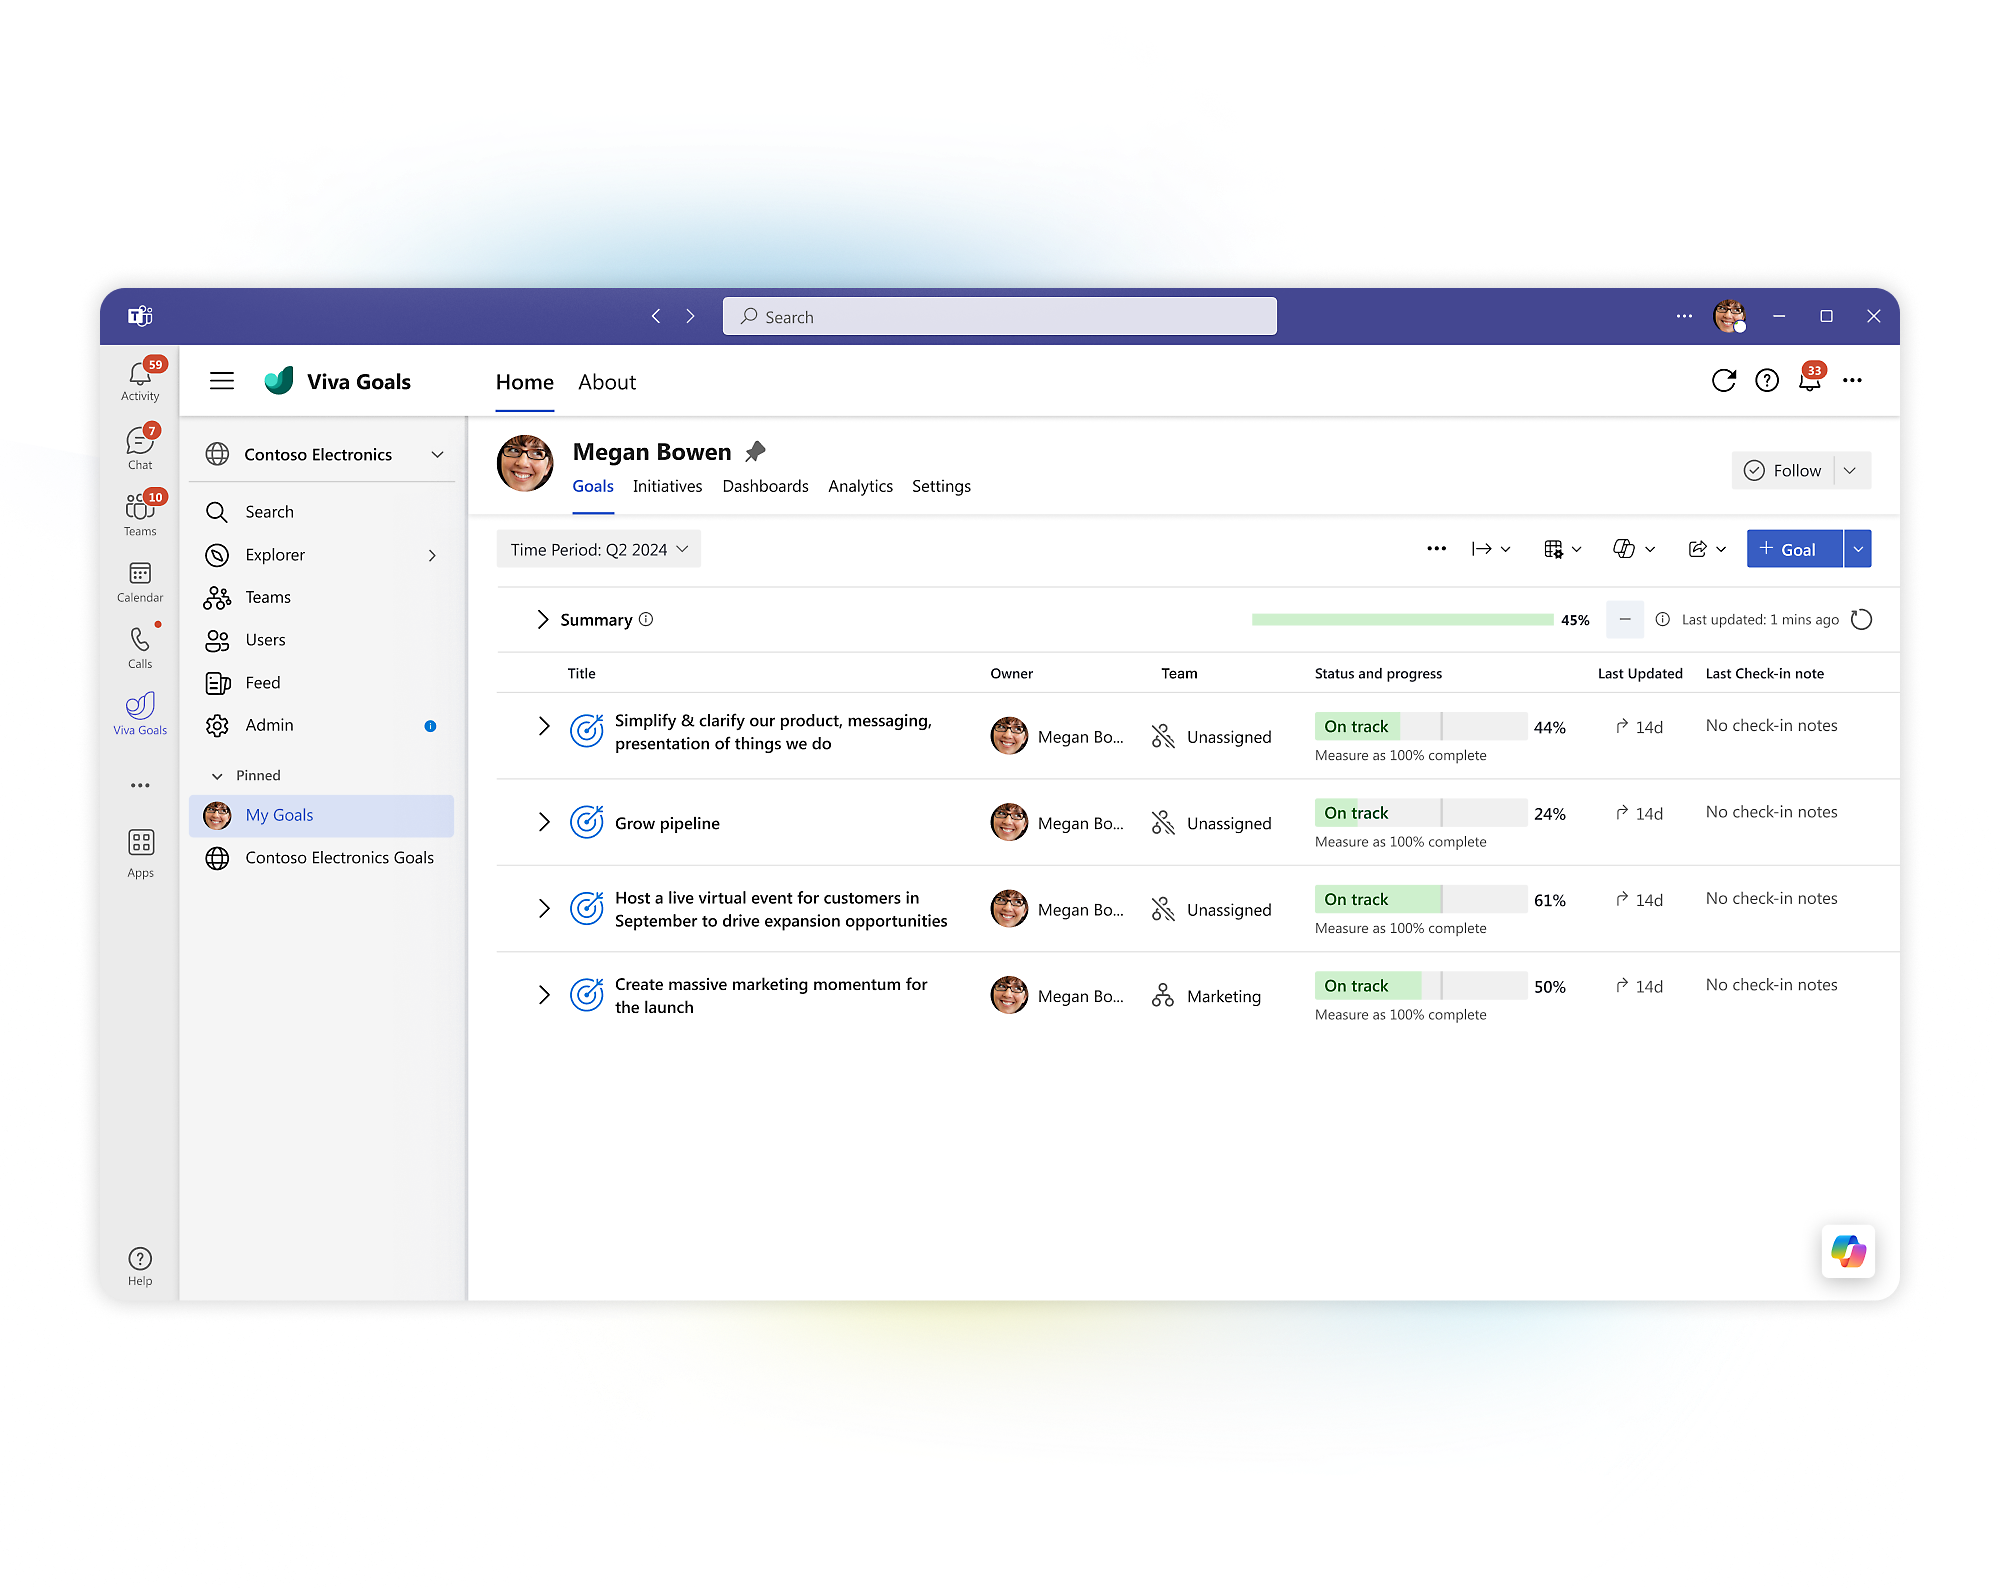
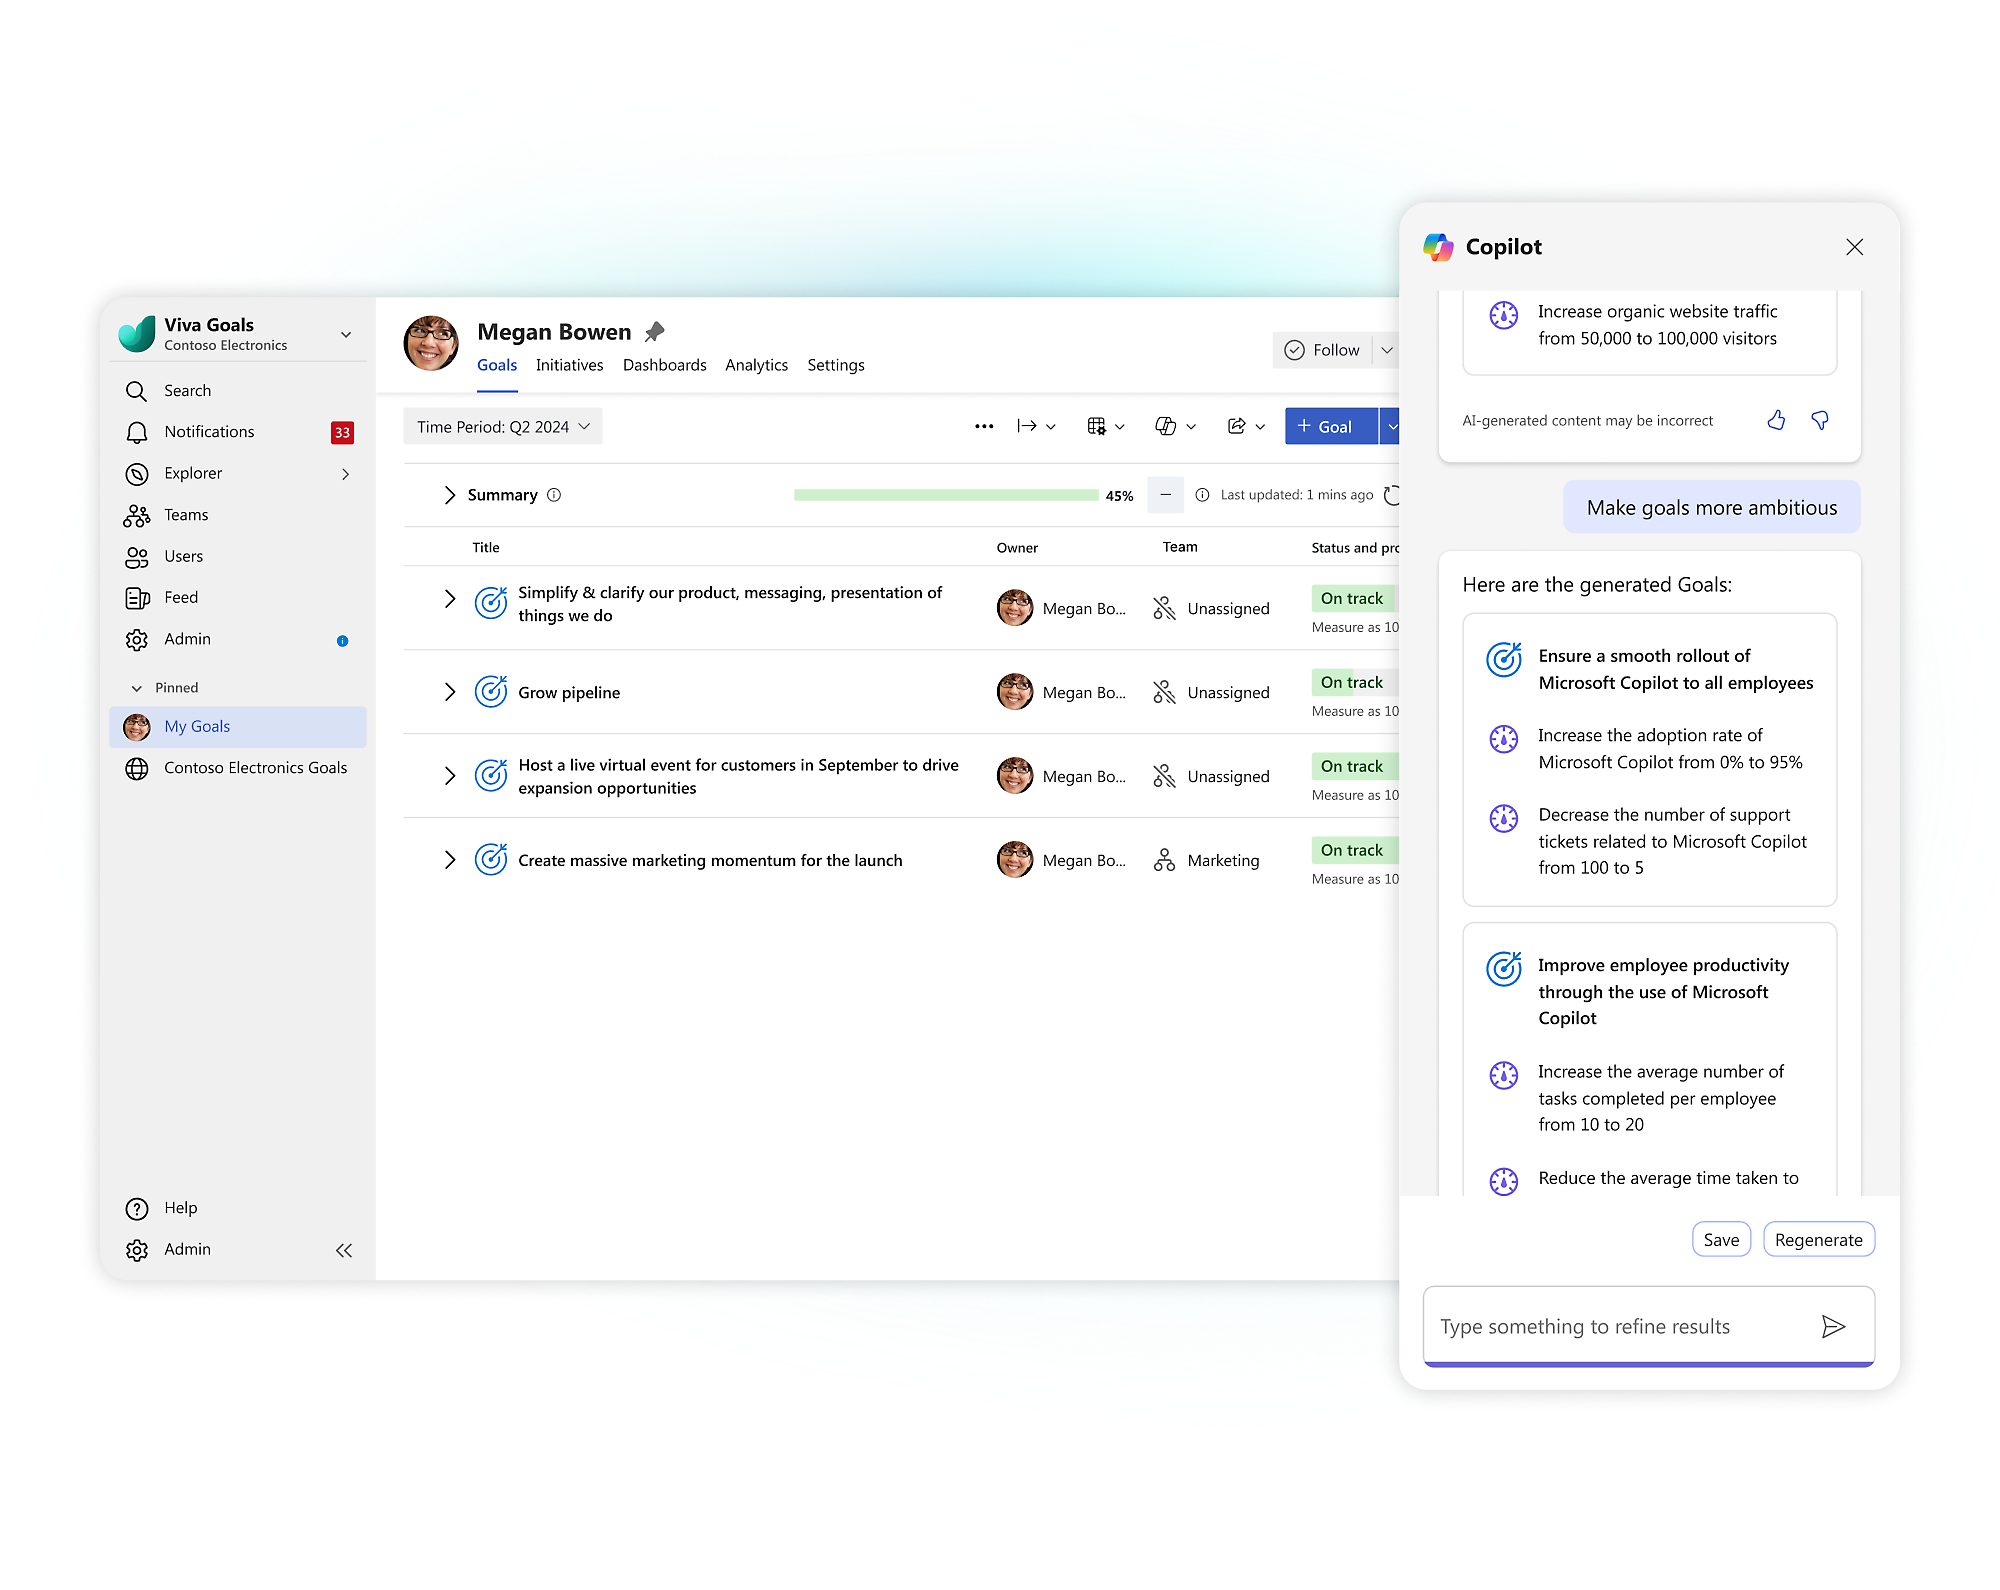
- Align your team and organizational goals to achieve successful results.Use proven goal management frameworks such as objectives and key results (OKRs).Ask Copilot in Viva Goals to refine existing goals or draft new goals from documents or prompts.
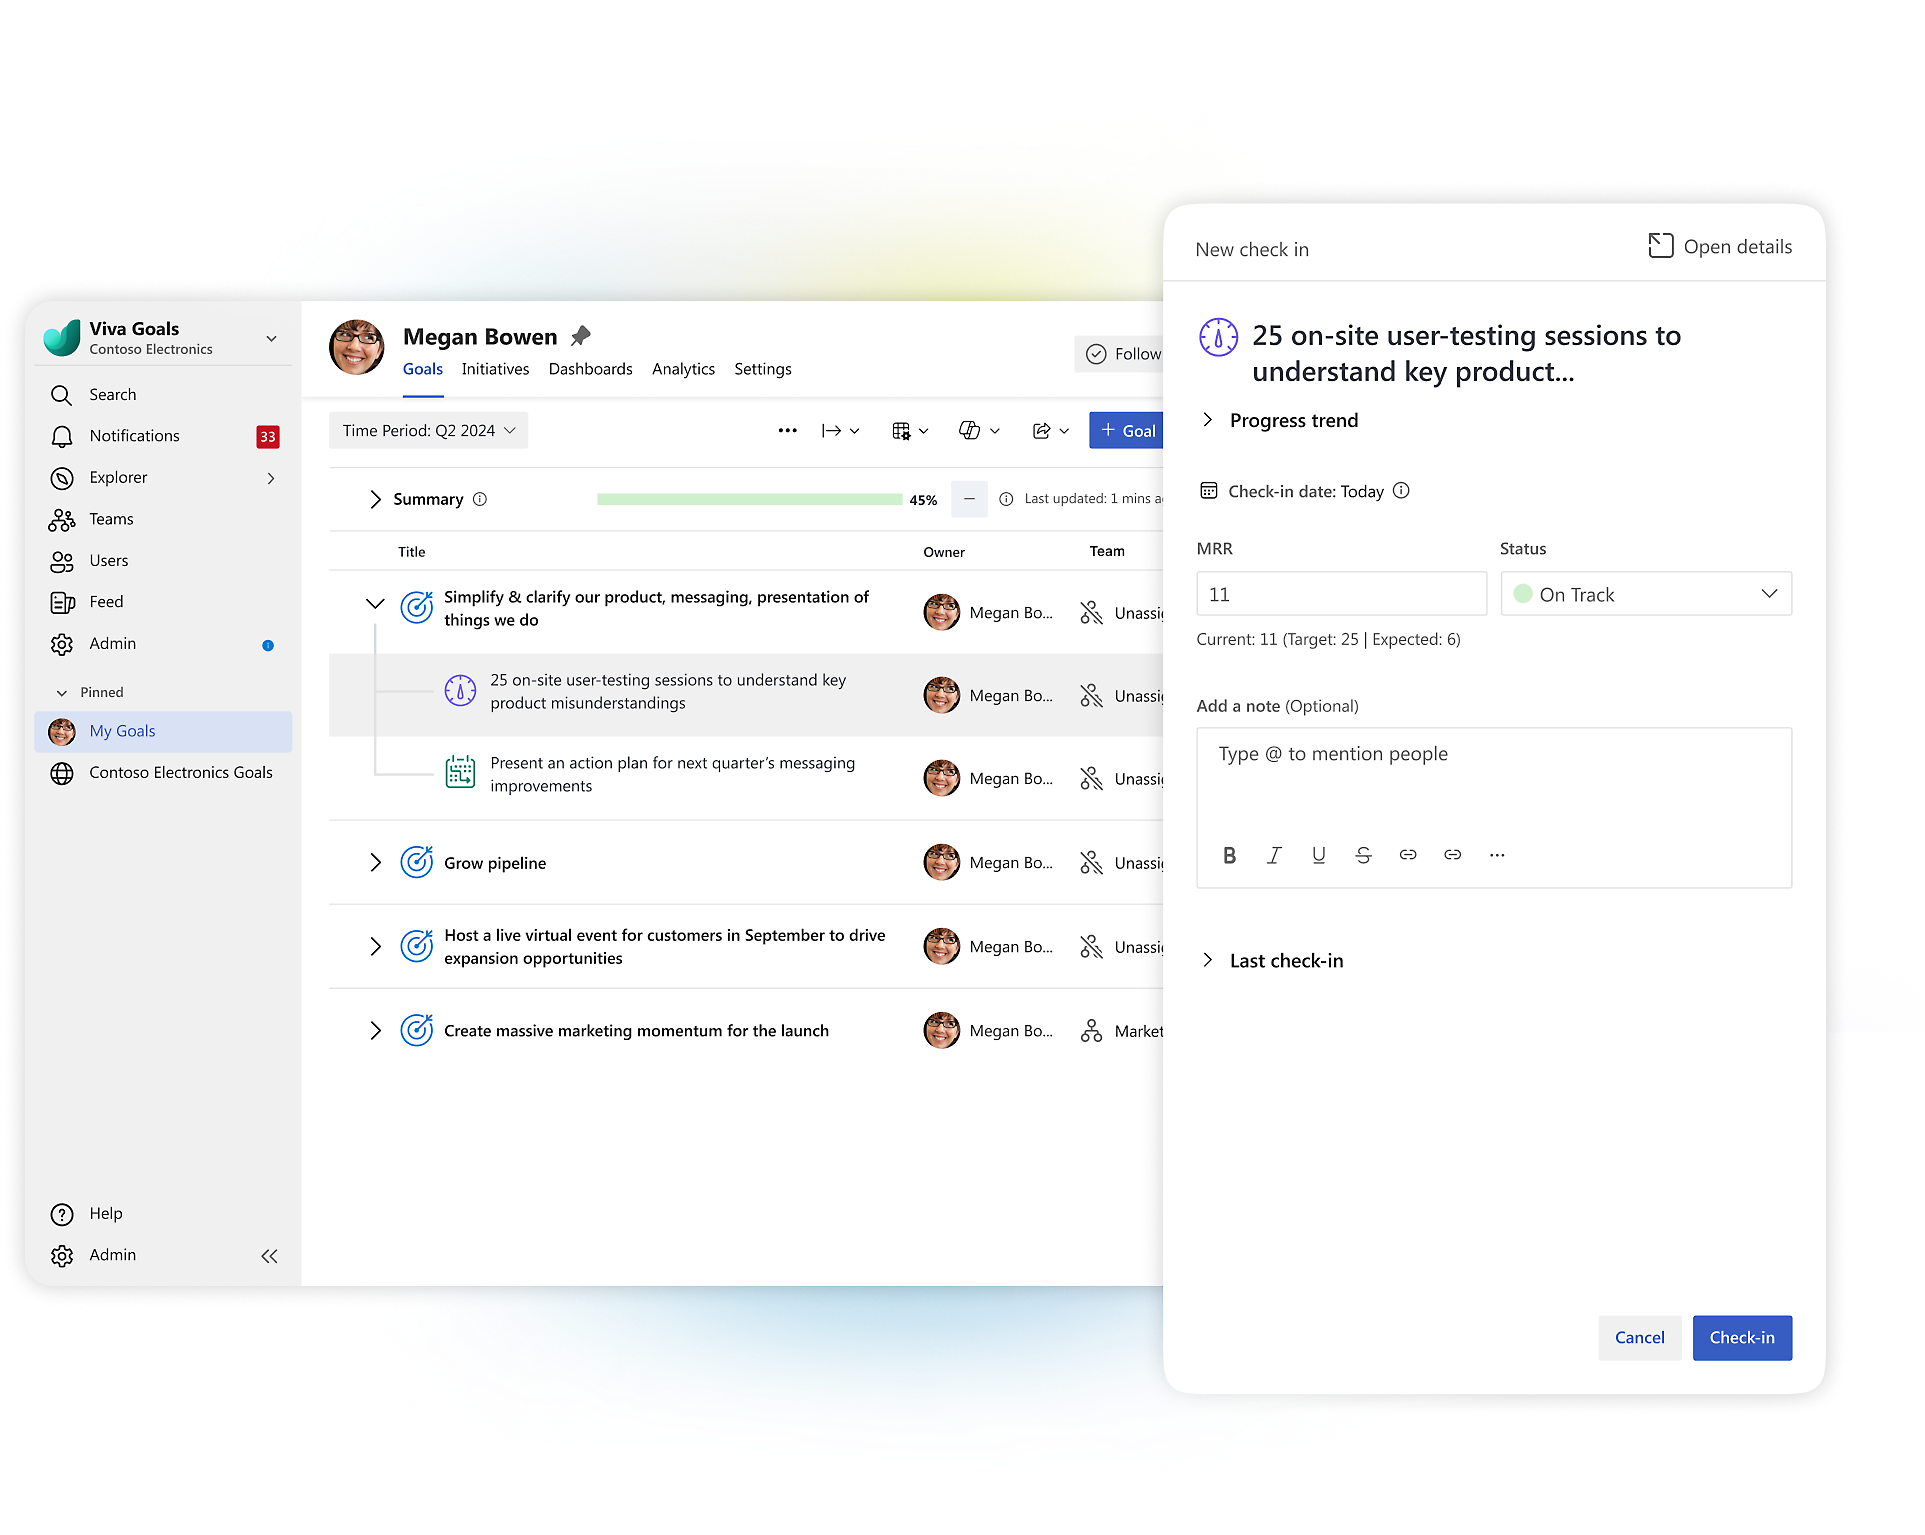
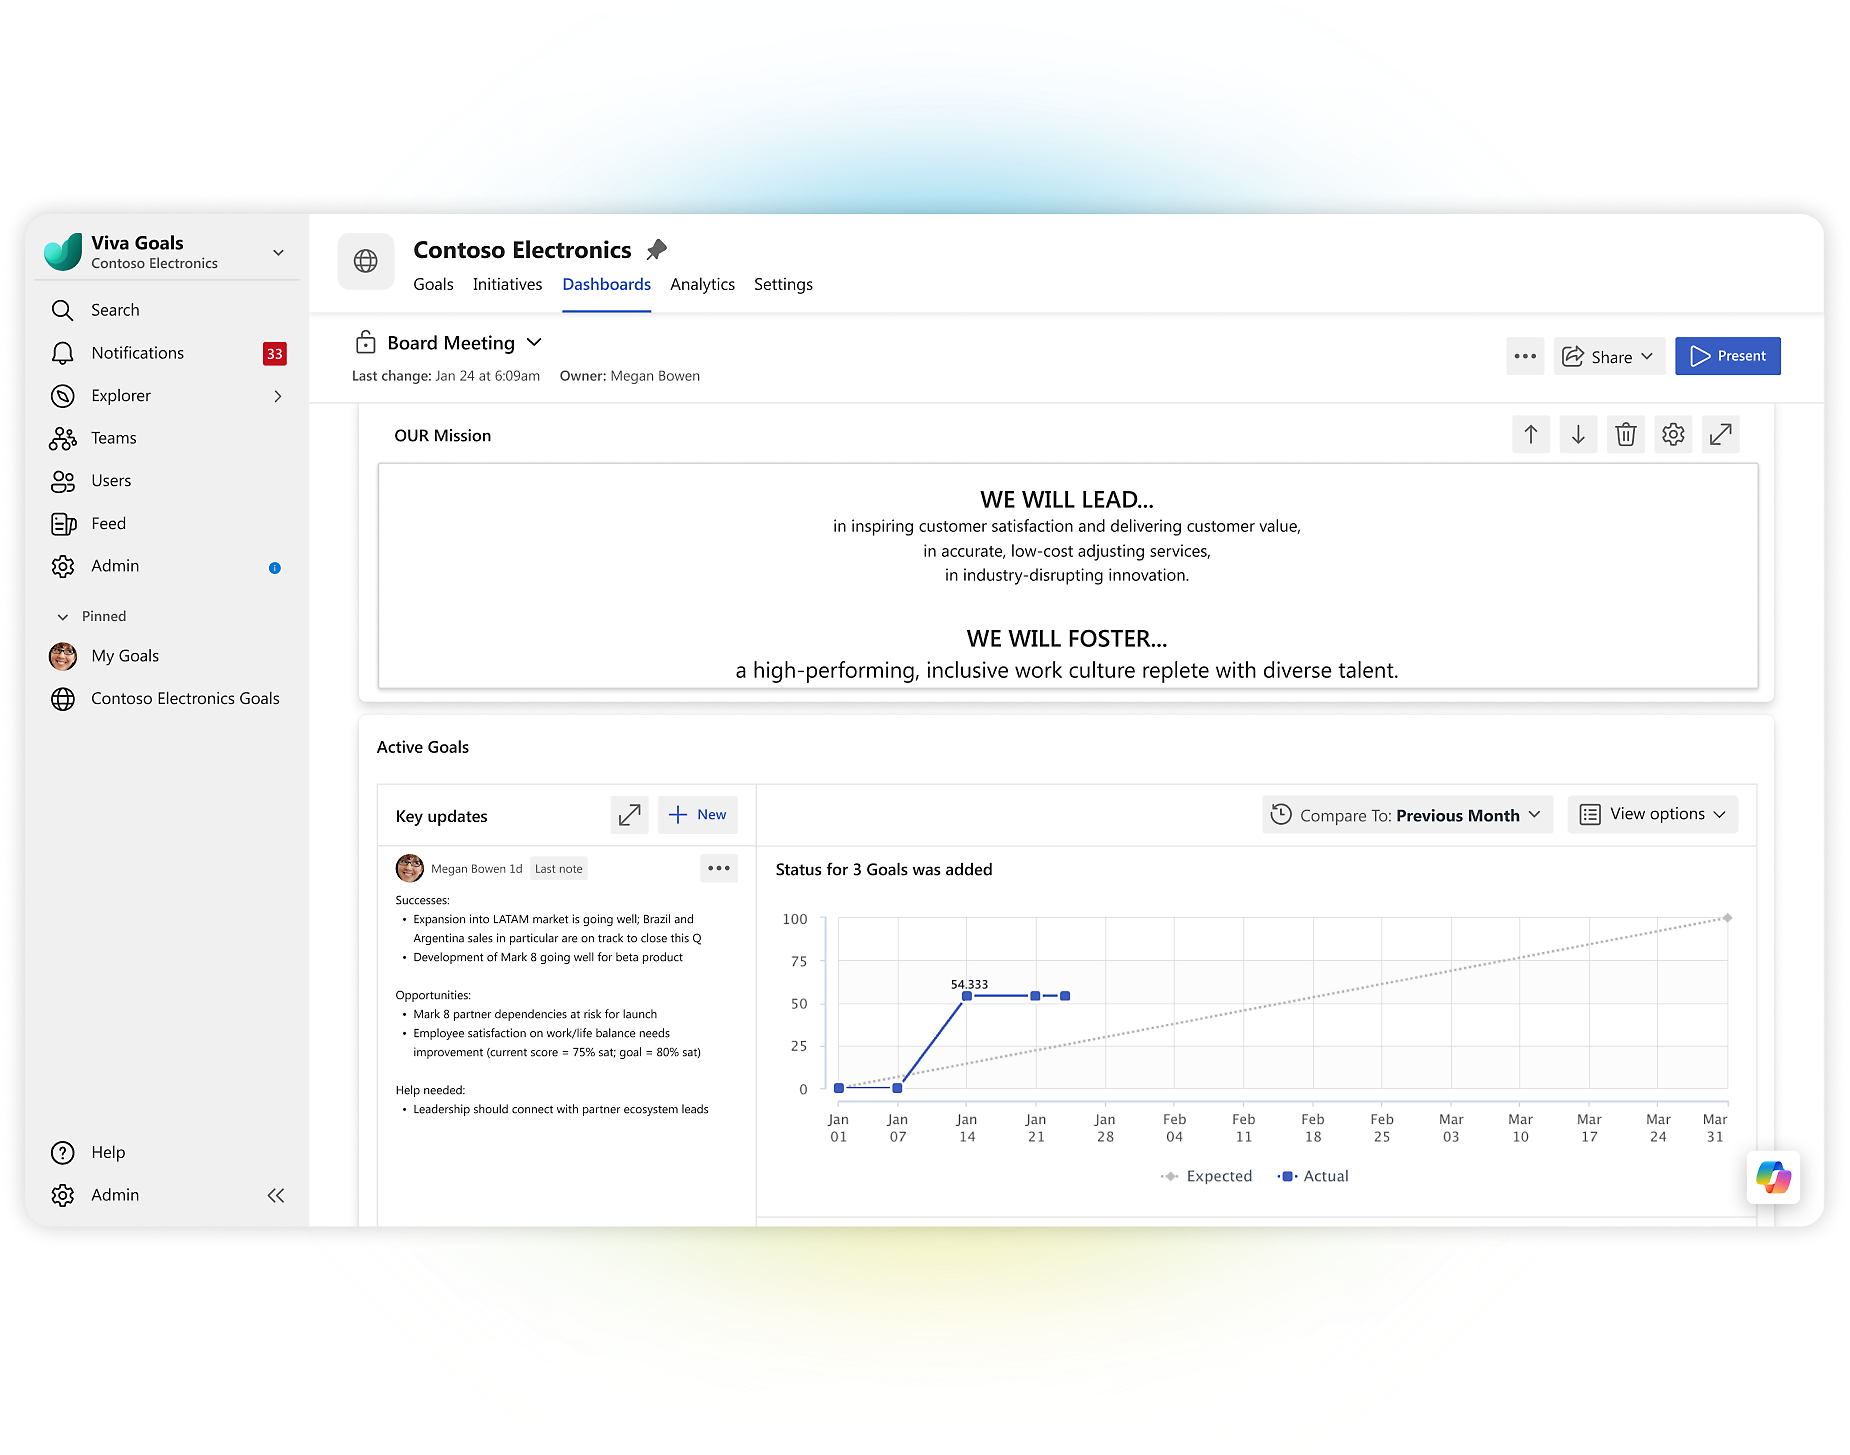
- Obtain progress updates quickly and easily with regular check-ins.Effortlessly share updates with your team through Microsoft Teams and Outlook.Easily report and present goal progress with built-in dashboard templates.
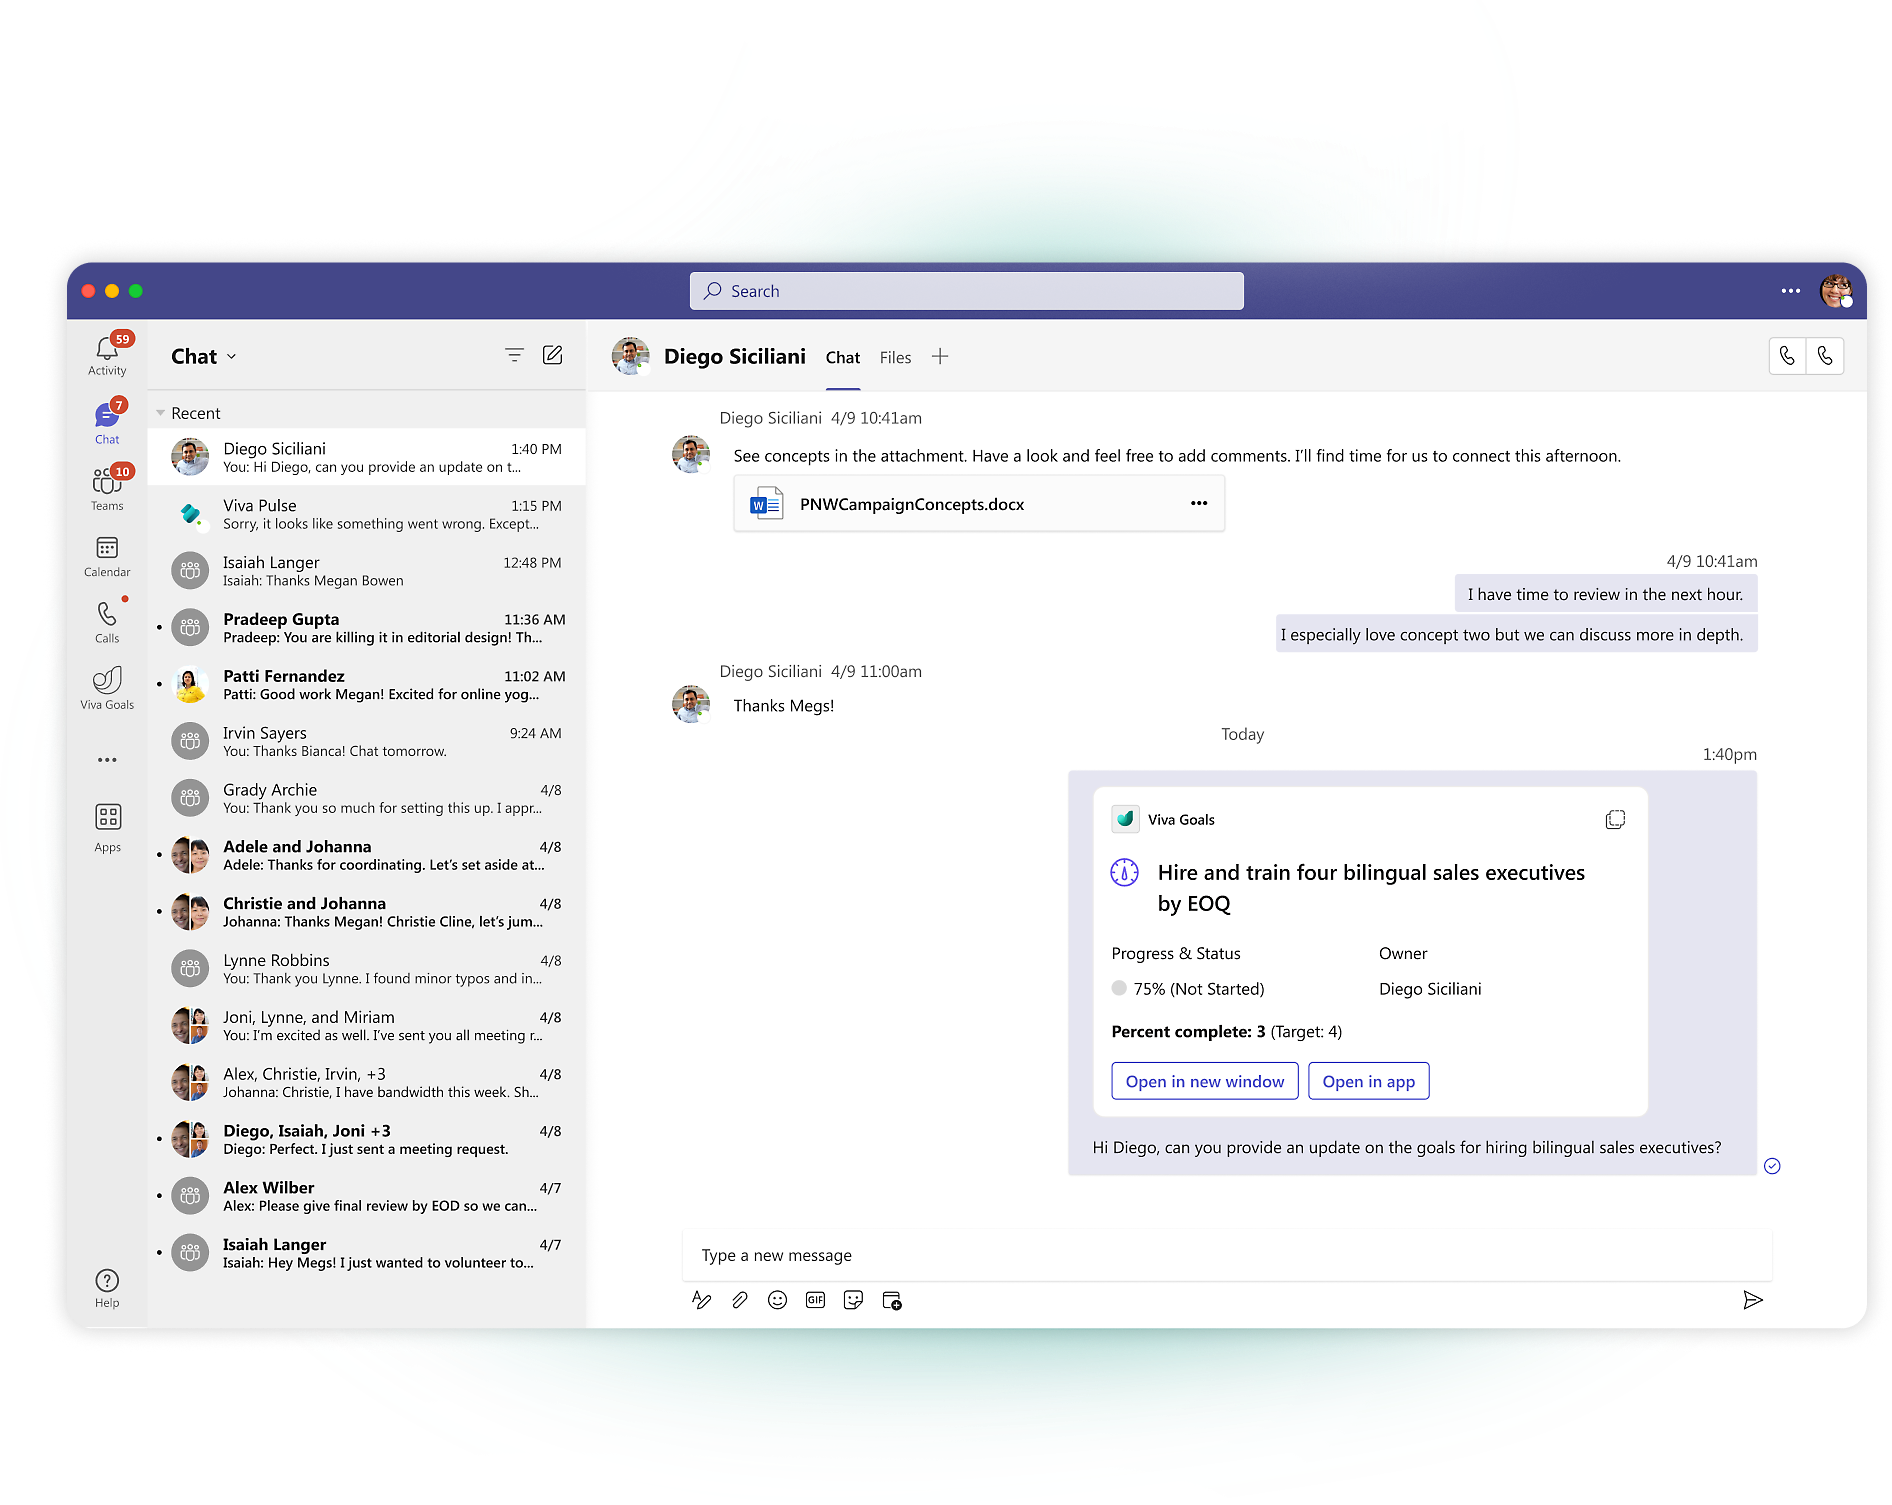
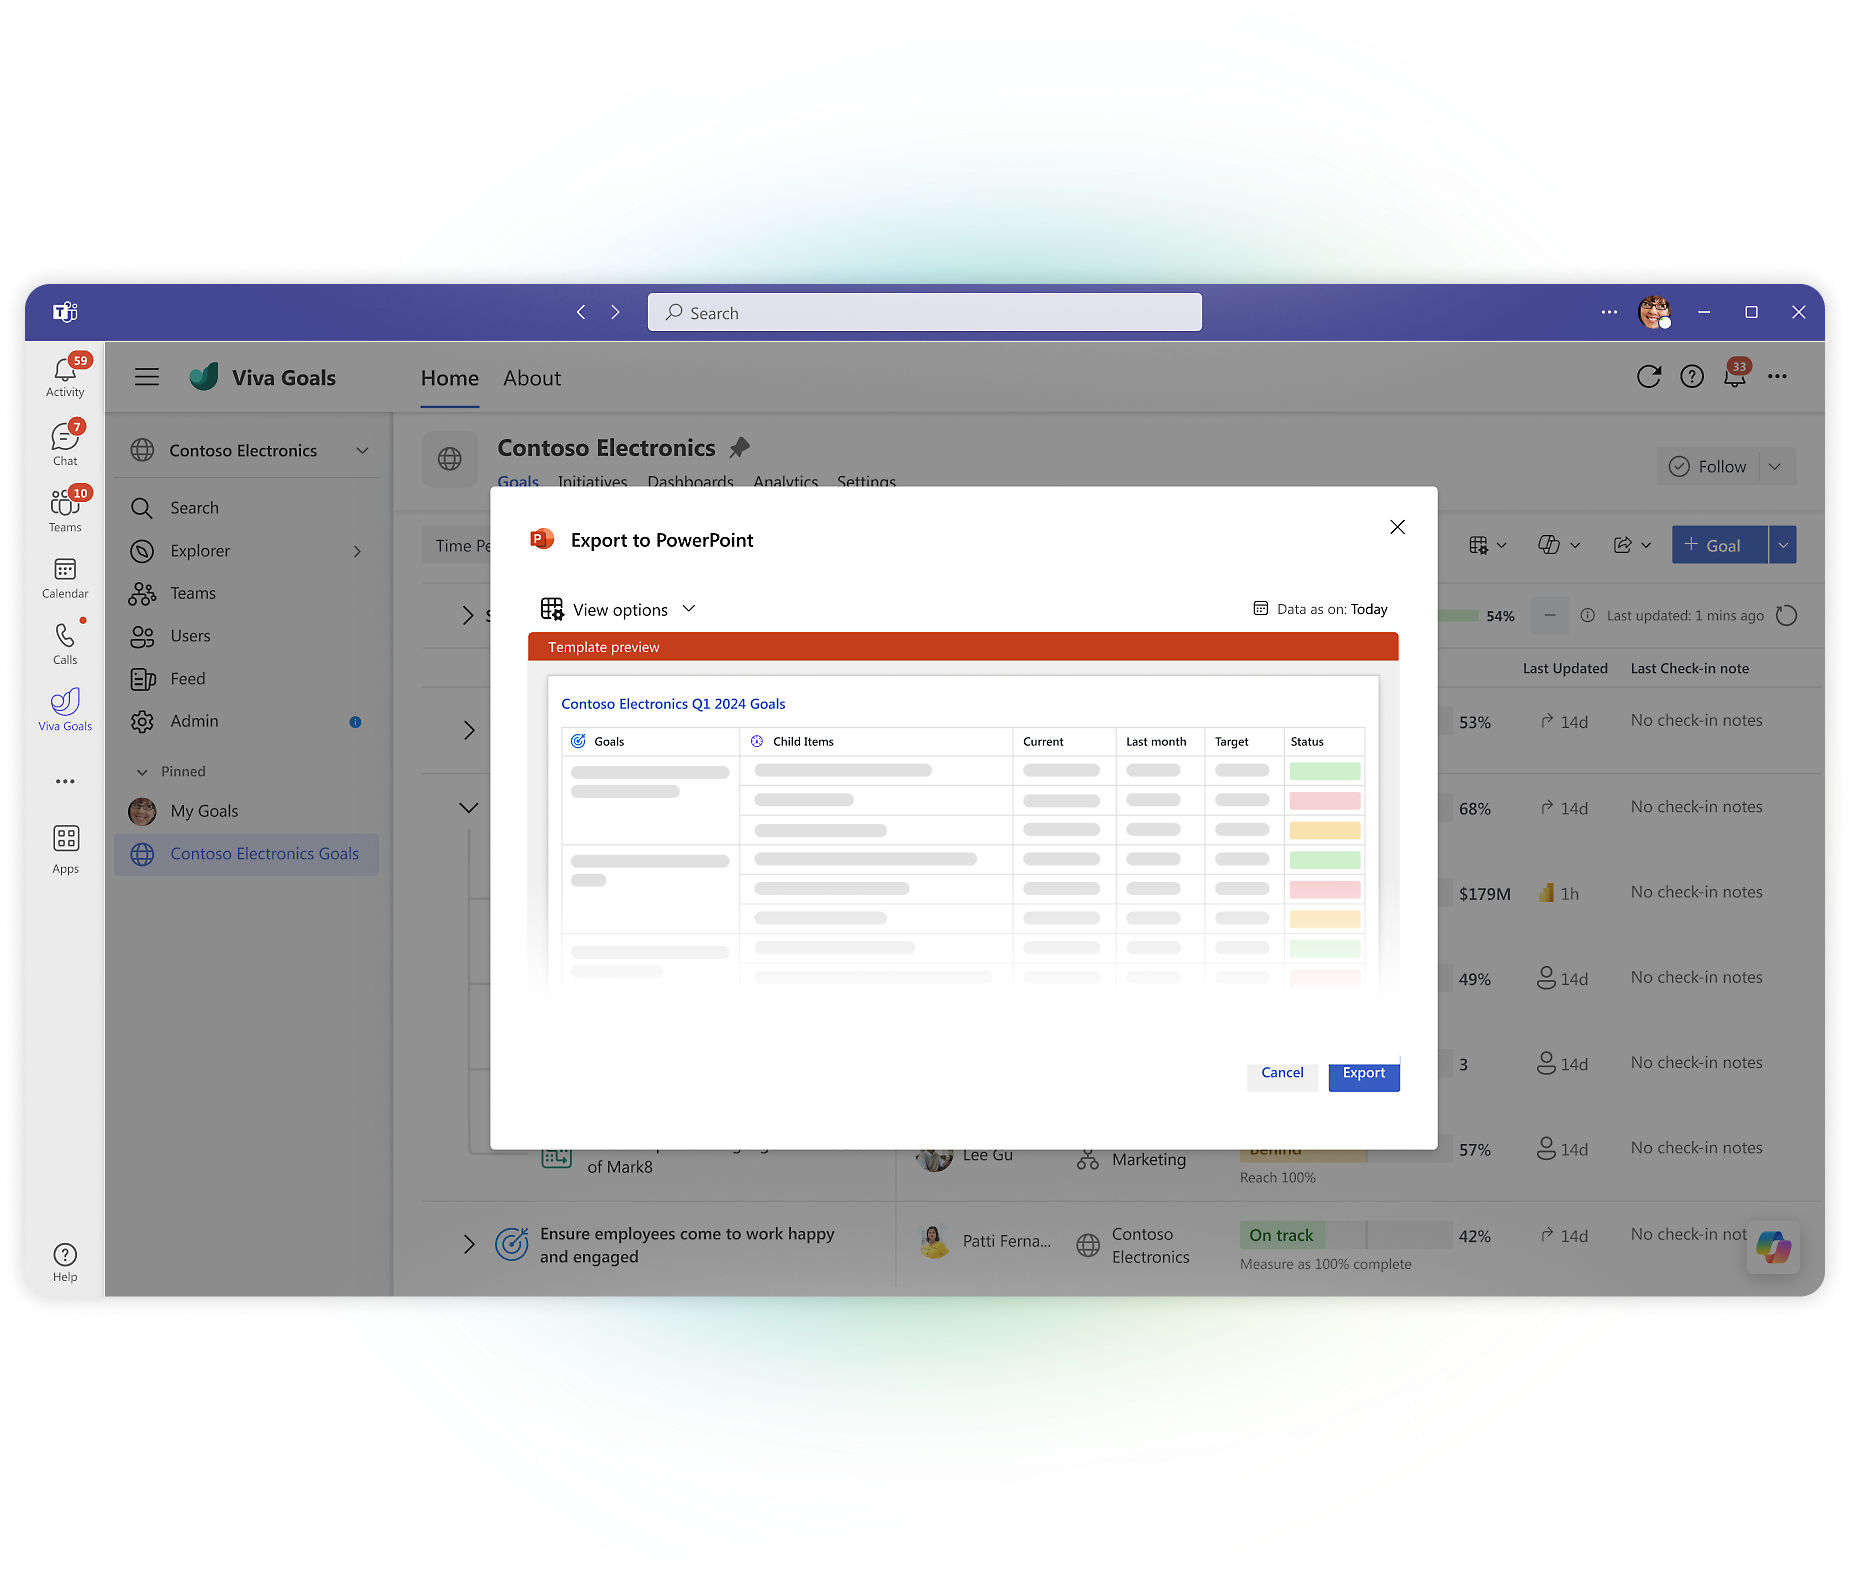
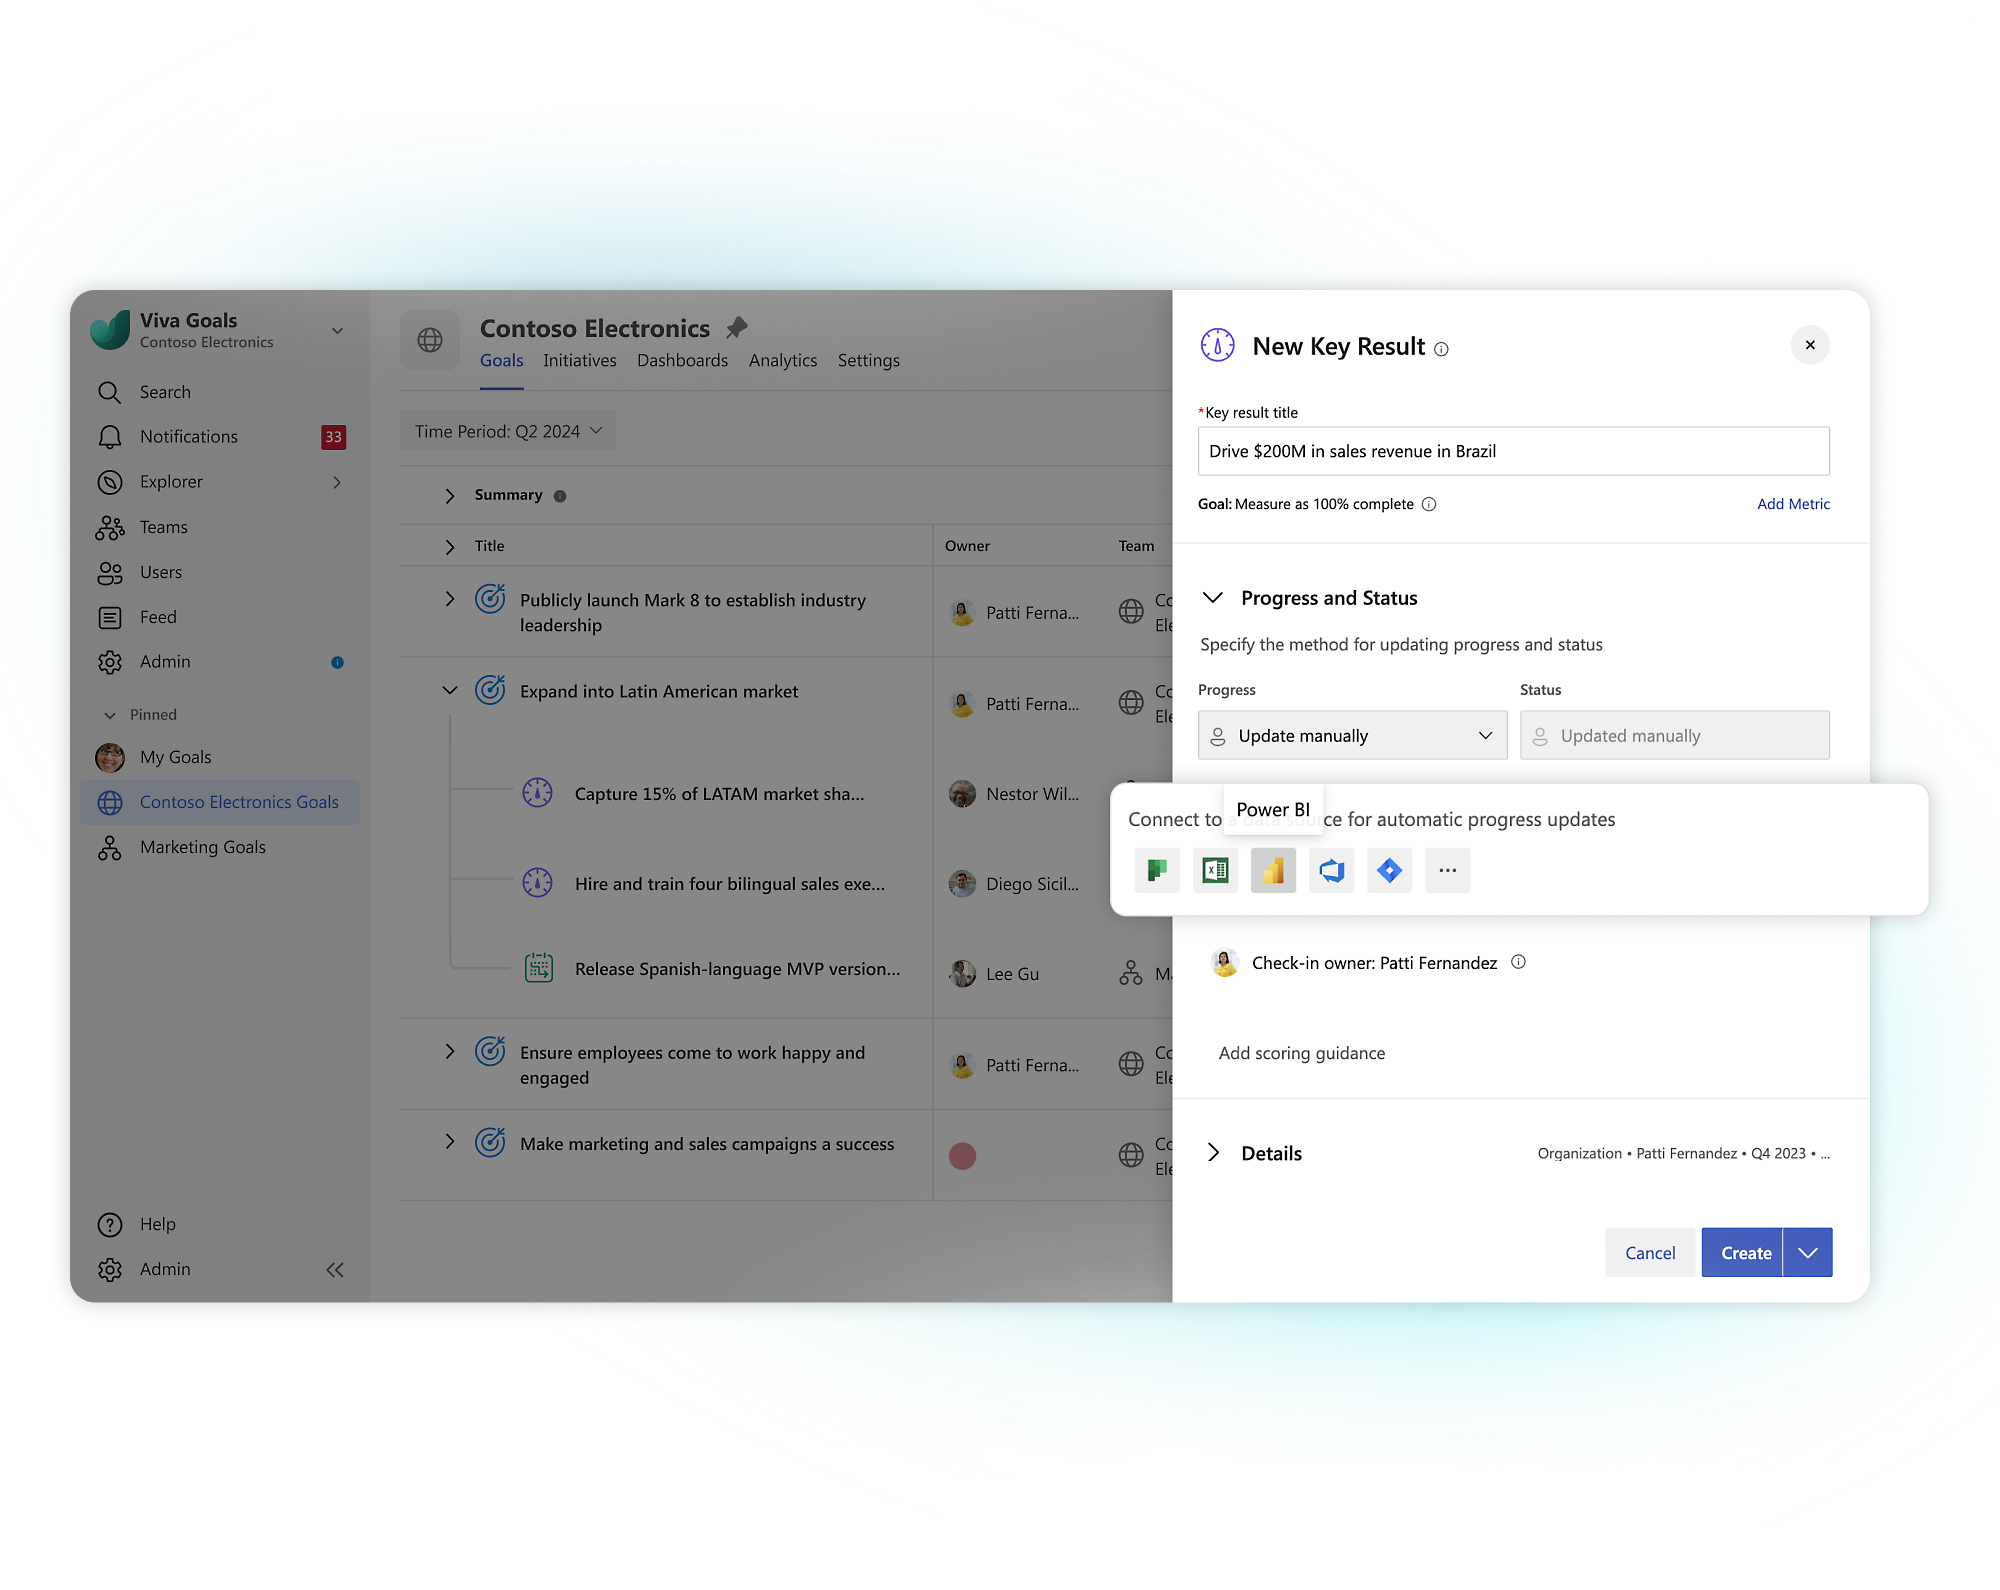
- Bring goals into conversations, share progress, and make updates to goals directly in Teams.Easily present goal summaries in PowerPoint with ready-made presentation templates.Automatically update goal progress with built-in data integrations to simplify tracking and enhance data visualization.
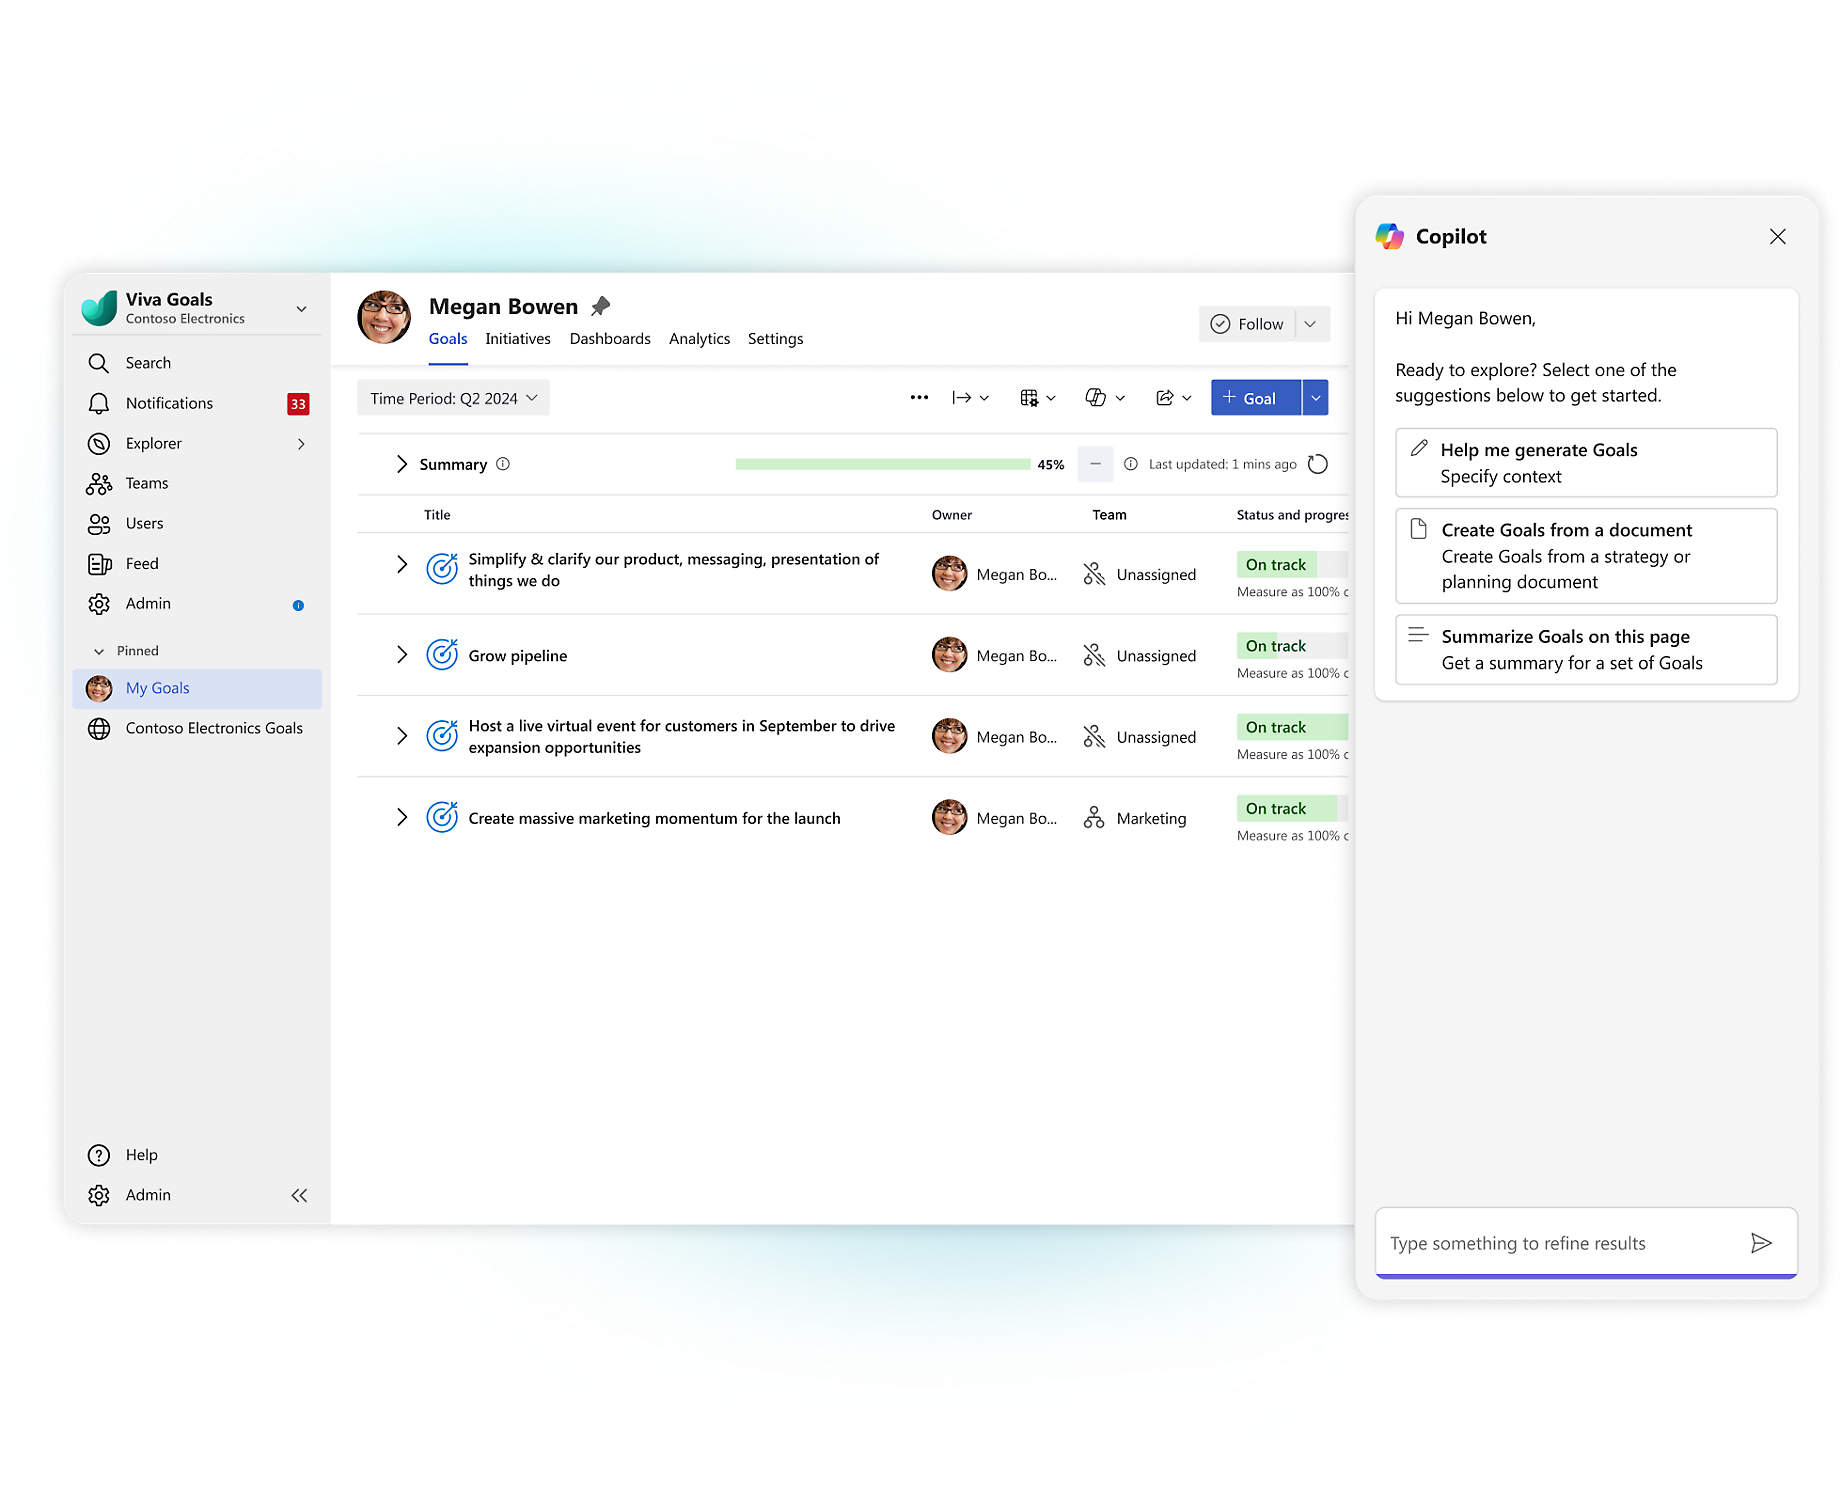
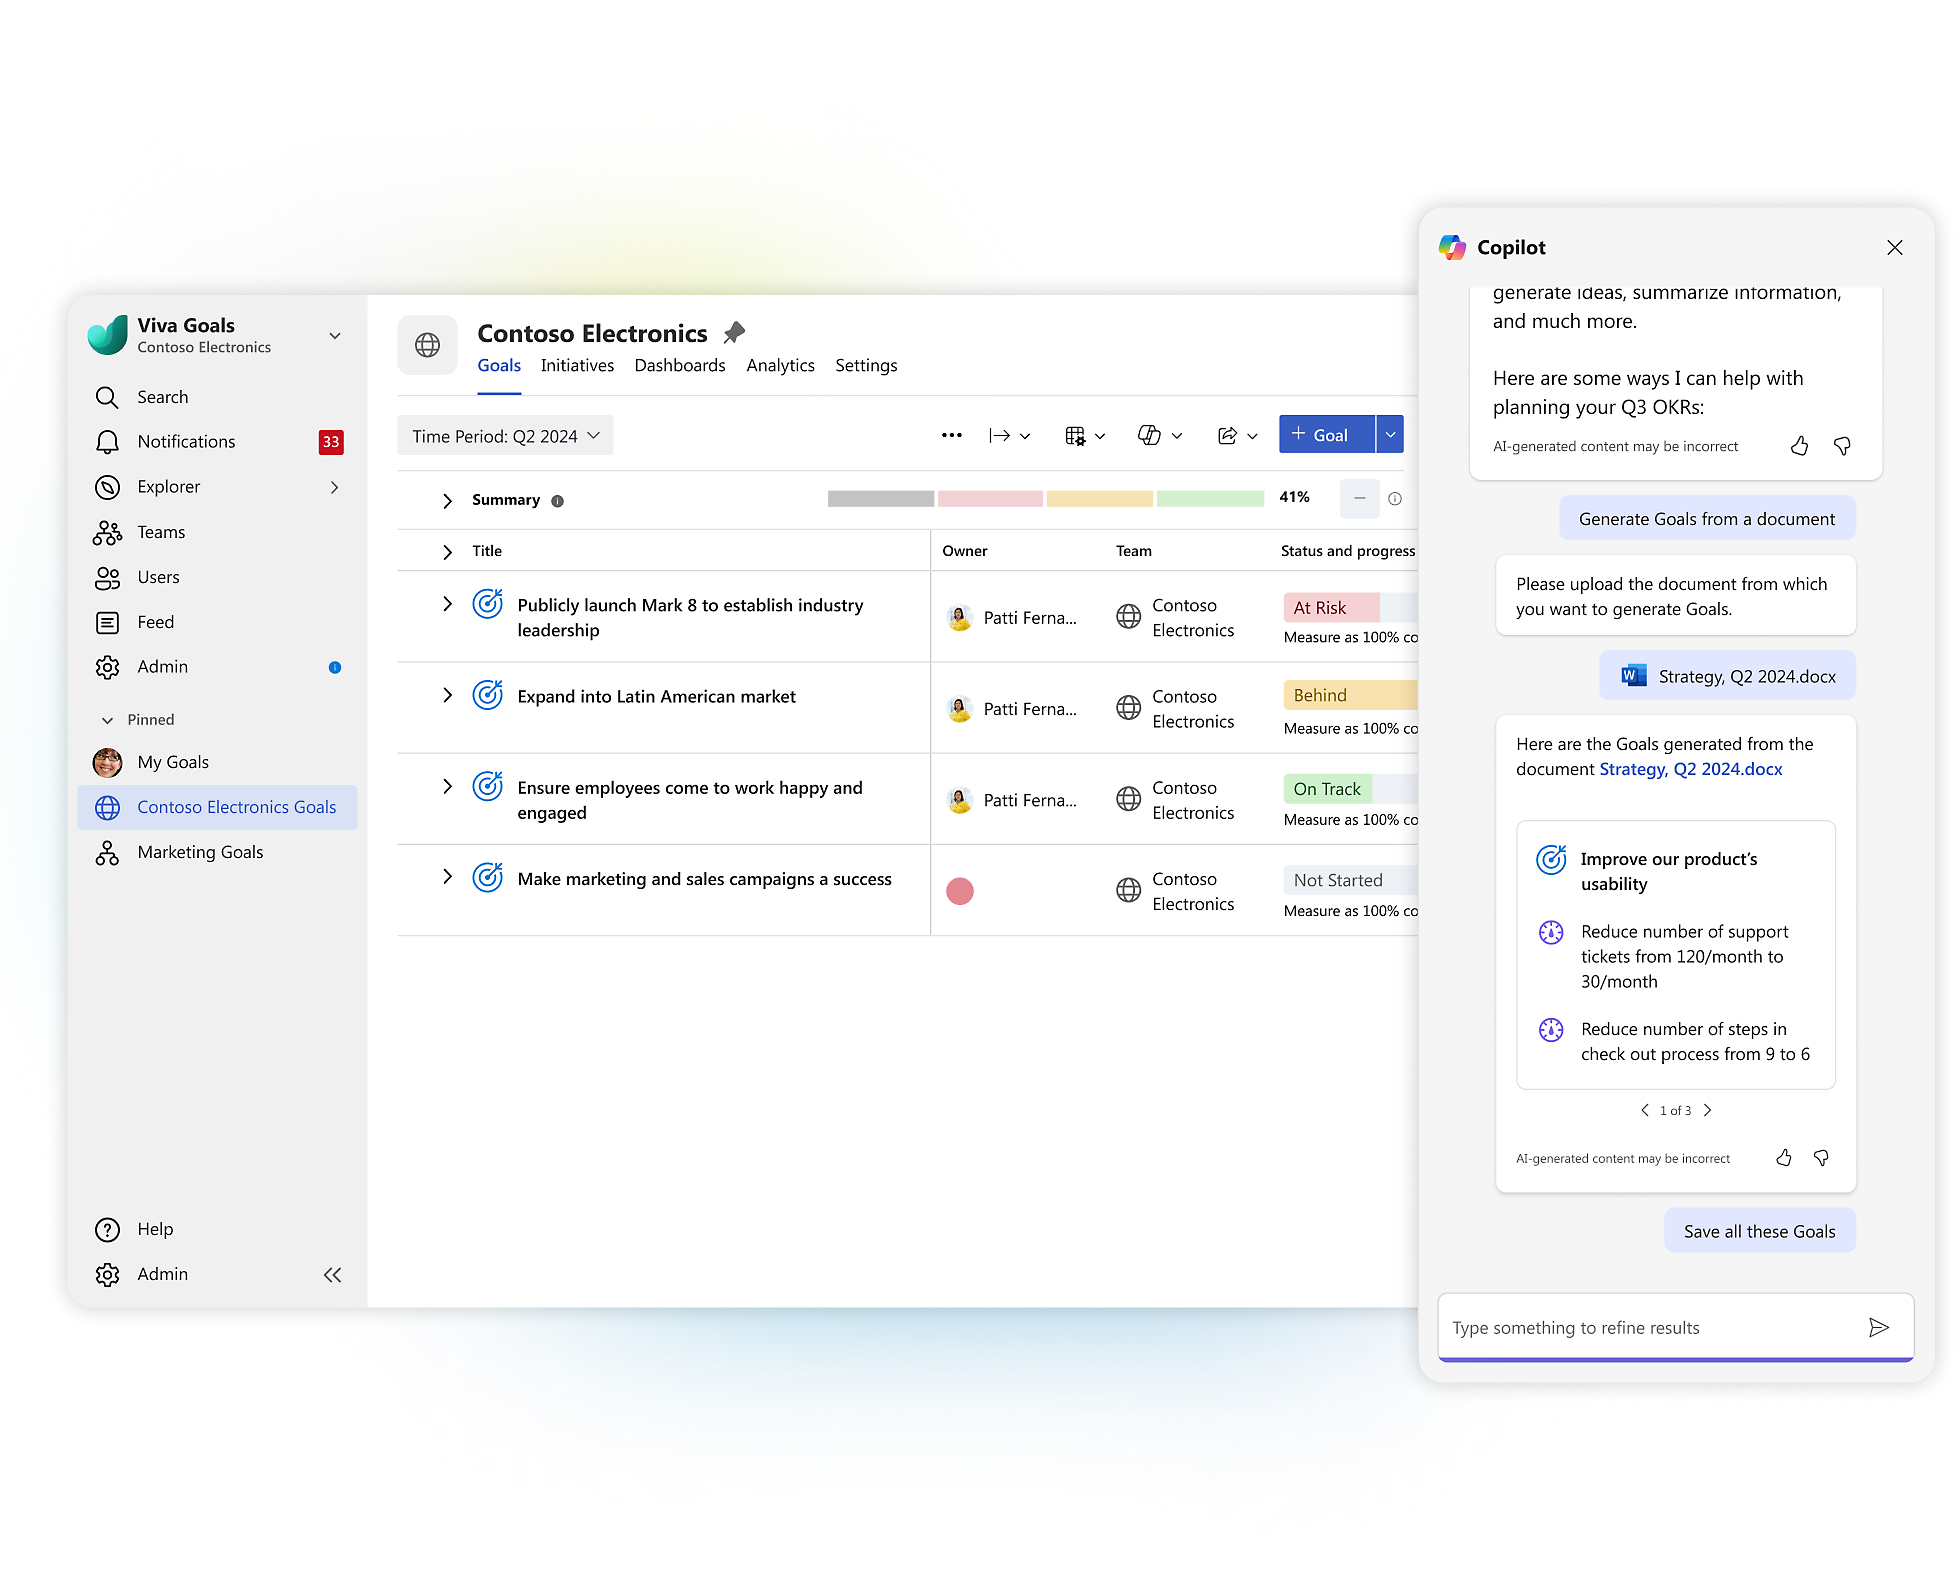
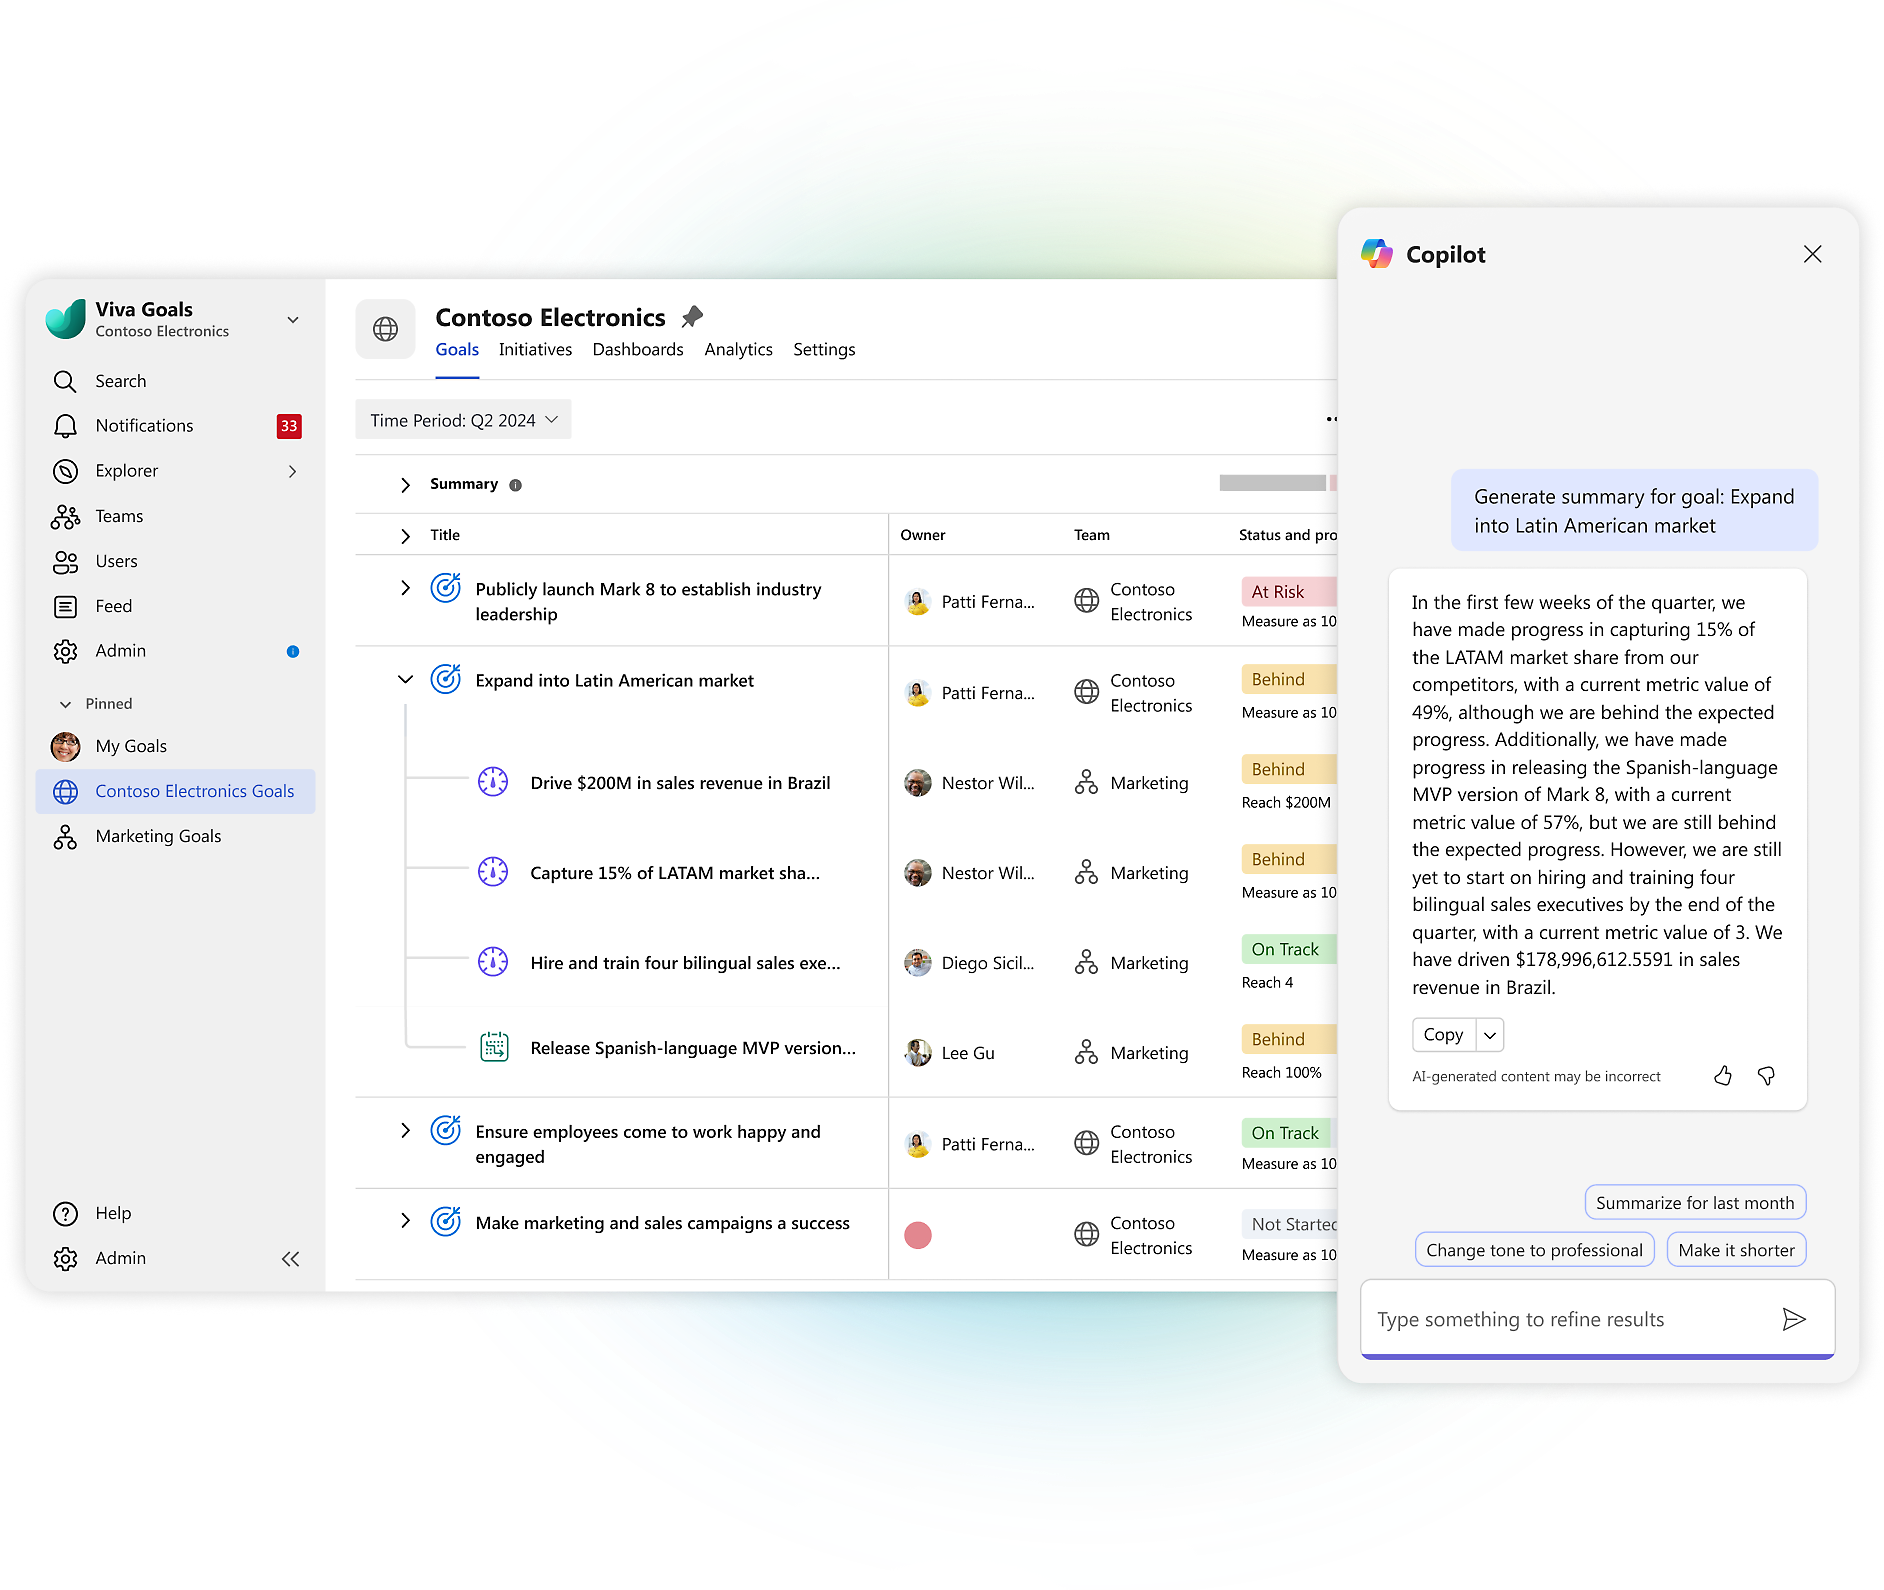
- Use Copilot to recommend goals using existing strategy documents or natural language prompts.Get personalized guidance with AI recommendations to tailor your goals to your business needs.Create comprehensive check-ins for each goal with AI-generated summaries that reference previous progress updates.
Drive results

Generate goal recommendations using AI
Easily summarize your goal progress using AI
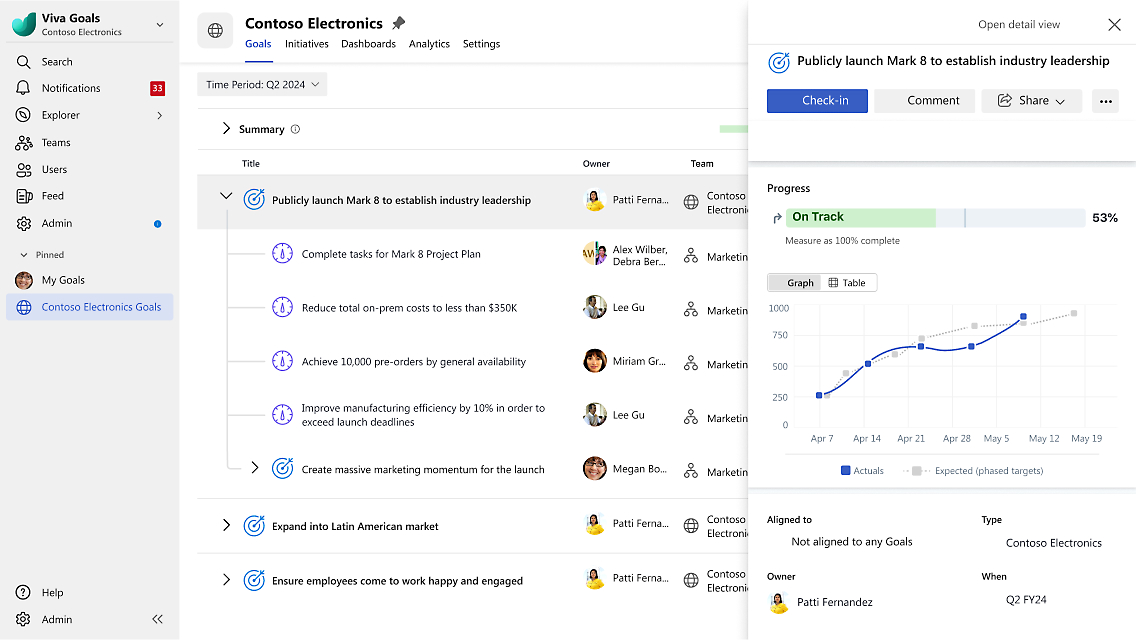
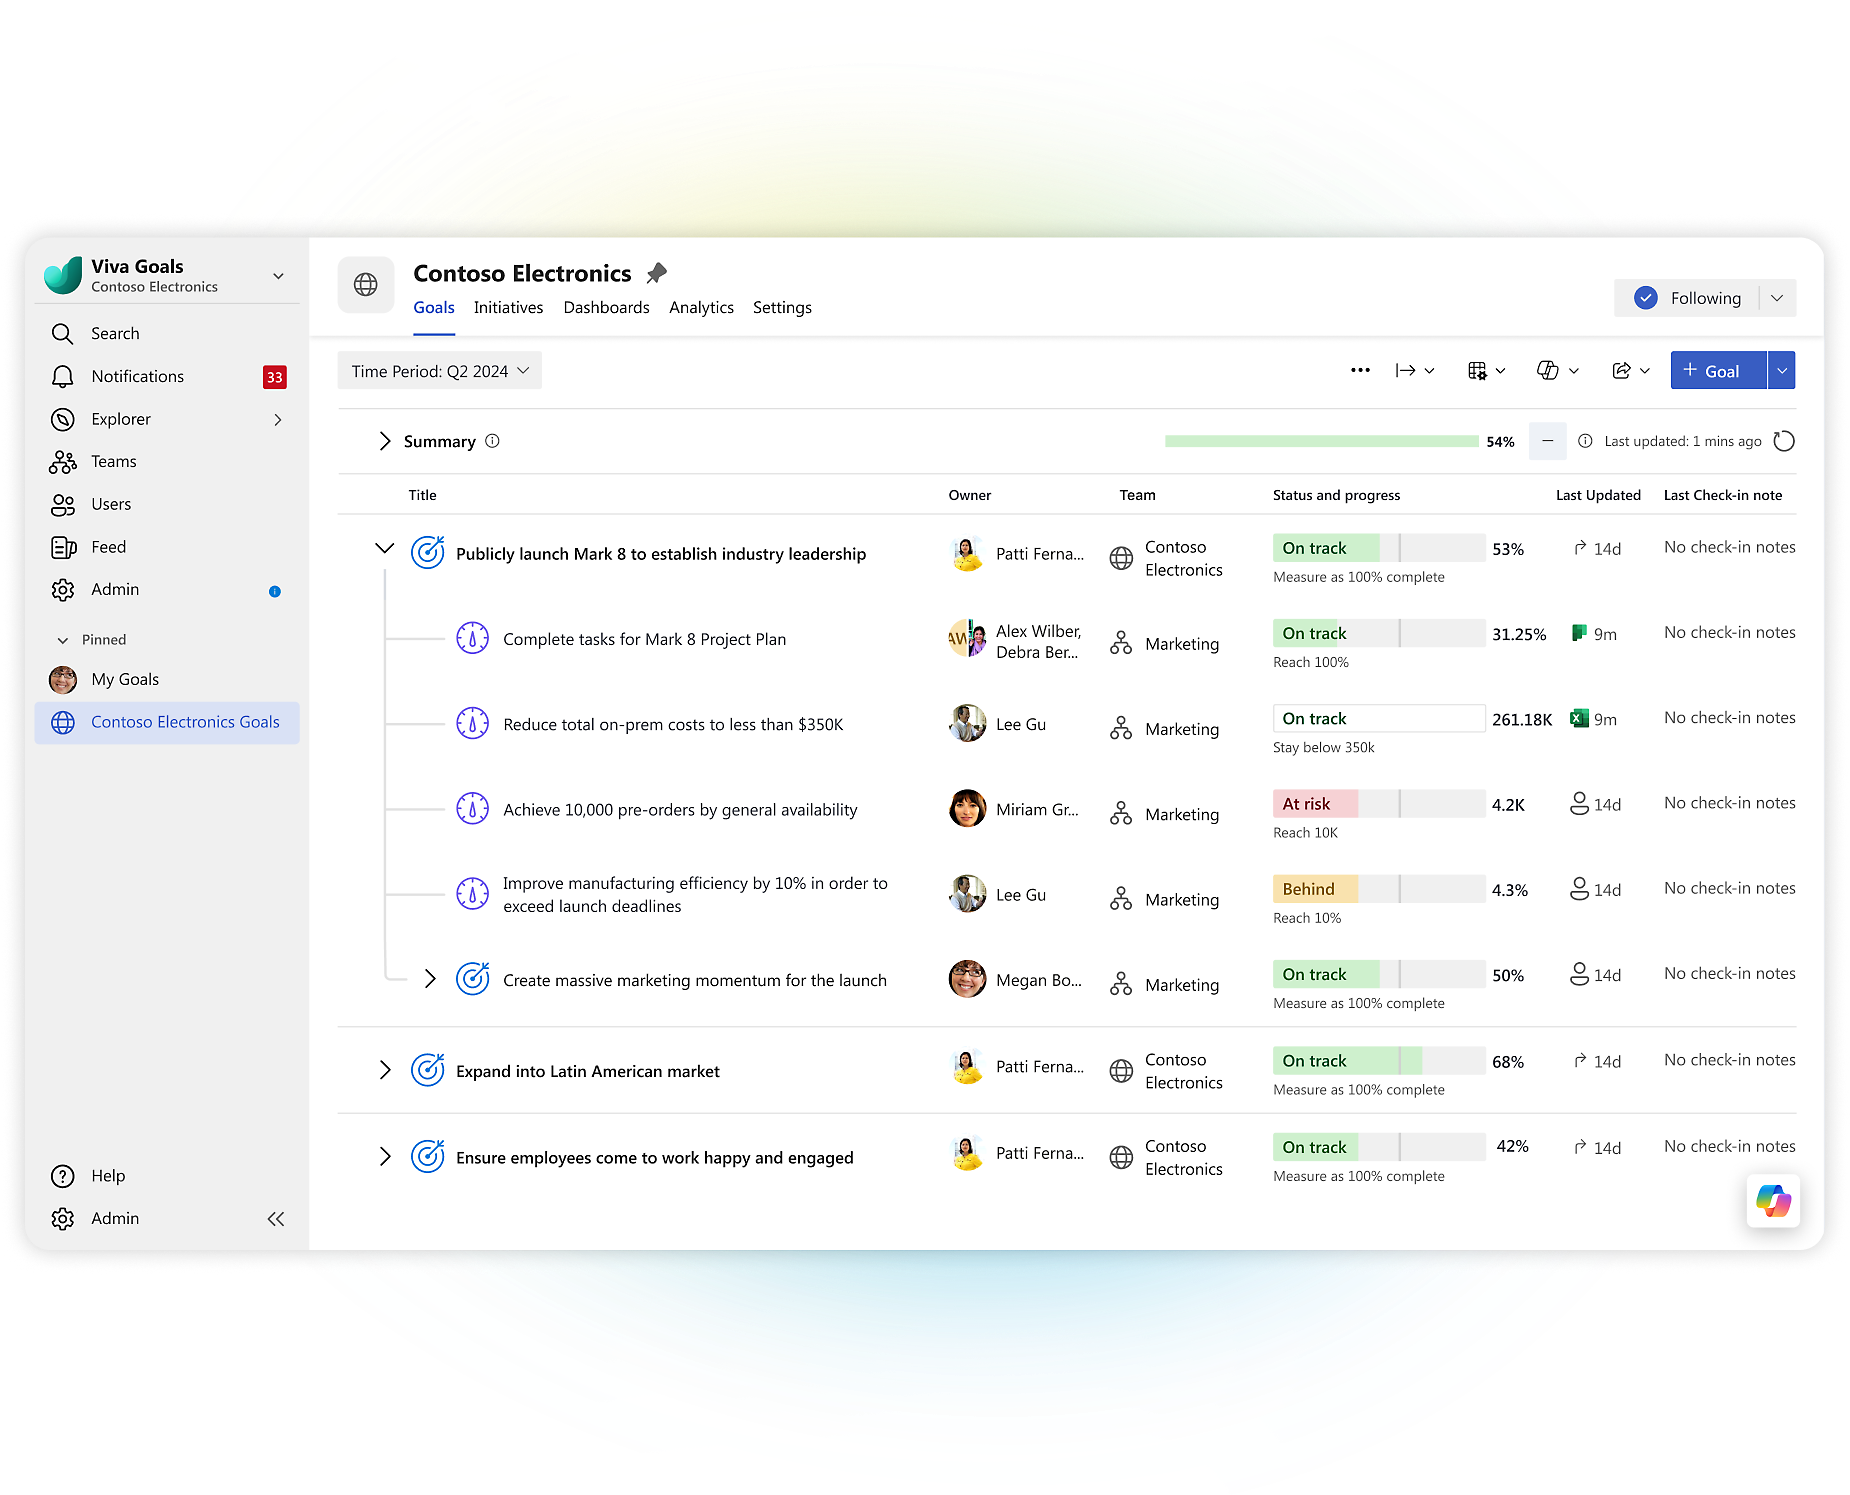
Align your teams with clear and prioritized goals
Foster alignment by sharing goals with the community
Connect goals to data sources for progress check-ins
Share goal progress with built-in presentation templates

Viva plans and pricing
Microsoft Viva Goals
- AI-powered goal recommendations and summaries
- Built-in dashboards and presentation templates
- Data integrations for automated progress updates
-
Viva Goals aligns your teams and drives results by managing your business goals in one location.
Microsoft Viva Suite
Everything in Viva Learning, plus:
- Unique, company-branded employee apps1
- Premium community, knowledge, and leadership experiences
- Centralized campaign management for communications2
- Data-driven insights for managers and leaders
- Feedback surveys with actionable recommendations
- Brief team surveys for managers and leads2
- Recommendations and academies for targeted upskilling2
- AI-generated insights and prompts with Copilot in Viva (coming soon)
-
Viva Goals aligns your teams and drives results by managing your business goals in one location.
-
Viva Connections helps employees explore news, join conversations, and connect across the organization.
-
Viva Engage connects everyone at your organization through employee communities and conversations.
-
Viva Amplify manages employee-facing campaigns from one convenient location.
-
Viva Insights helps improve productivity and wellbeing with insights and recommendations.
-
Viva Glint helps you understand the voice of the employee to continuously improve your organization.
-
Viva Pulse provides actionable team feedback with quick surveys for managers and leaders.
-
Viva Learning seamlessly integrates access to learning content in the flow of work.
-

Try a demo of Viva Goals

Implementation and support

Get started using Viva Goals in your organization.

Start your Viva Goals adoption journey today.

Find Viva Goals help and learning content for employees.
Frequently asked questions
- Viva Goals licenses include access to the Viva Goals app in Teams1 and on the web.
• Create and manage your goals with built-in templates, automated check-ins, and AI-powered guidance.• Drive your rhythms of business with easy-to-use dashboards and sharing capabilities.
• Connect work to outcomes by using Viva Goals with applications you use for managing tasks and projects.
- Viva Goals is available as an app in Microsoft Teams and as a web app. The Viva Goals web app has no prerequisites—customers can purchase and use it without any other Microsoft product or subscription.
A Teams product license is required to use the Viva Goals app in Teams.1
- Yes, Viva Goals is available in all Microsoft global markets.
- Copilot in Viva Goals provides AI-powered guidance and support using natural language prompts.
Copilot helps you:
• Create new goals from suggestions and context you provide.
• Create new goals from content in documents you select.
• Refine goals based on your queries.
• Summarize goals based on additional context.
- Yes, Viva Goals integrates with a number of other Microsoft 365 and non-Microsoft solutions, including Teams2, Azure DevOps, PowerBI, PowerPoint, and Excel.


Follow Microsoft 365